Moorer Reverb
(Software, Effect, Standalone)
Made with

Original Track: CocoaBeanz - Sogni d’oro, cara mia
A realtime 6 tap delay and allpass based stereo reverb modeled after James A. Moorer’s paper for Computer Music Journal titled “About This Reverberation Business.”
Built from the ground up using a custom audio processing library. User interface rendered with JUCE.
Made with
Principle
Moorer’s model represents a rectangular room with six walls, each represented by a lowpass comb (delay) filter.
Each delay time simulates its respective wall’s distance from the source, allowing the emulation of spaces of varying size and proportion.
Each wall’s lowpass coefficient corresponds to its high-frequency damping, which in practice is akin to the surface’s roughness and affect’s the echo’s perceived diffusion.
The dry/wet mix emulates the listener’s proximity to the source.
Note that comb and delay filters are mathematically equivalent. I will use the terms interchangeably.

Fig. 1: Room model with walls numbered by relative delay time
Design

Fig. 2: Moorer Reverb signal flow
DSP Architecture
After the signal is passed to the delay network, delay taps are summed, passed through an allpass filter, then mixed with a proportion of the dry signal (K).
The allpass filter generates phase distortion across the frequency domain, emulating some of the “scrambling” of acoustic reverberation. This also proves highly effective in stereo channel decorrelation (more on this later).
Yes, this transfer function is daunting. Breaking the environment into modular filter blocks makes the project much more manageable.

Eq. 1: Moorer Reverb transfer function for N delay taps
Lowpass Comb
This delay model allows for both feedforward (Z-Lf) and feedback (Z-Lb) delays. Dry signal can be introduced by coefficient d. The feedback insert path will operate on any DSP filters of any quantity, in parallel or in series.
In the case of a Moorer Reverb, feedback passes through a lowpass filter to emulate high-frequency damping.
As a fun aside, lowpass filters are also simply delays.
In my implementation, this reverb is entirely composed of modules derived from my feedback+feedforward echo class.
This means that delays and lowpasses could be nested indefinitely for more complex reverb modeling.

Fig. 3: Lowpass comb (delay) with lowpass feedback insert

Eq. 2: Lowpass filter transfer function

Eq. 3: Lowpass comb transfer function

Fig. 4: Allpass filter signal diagram
Allpass
The allpass is, once again, a variation on feedback and feedforward delay. The mix coefficients a and -a between the two m-delayed paths are inverted, producing the frequency-dependent phase distortion we need.

Eq. 4: Allpass filter transfer function
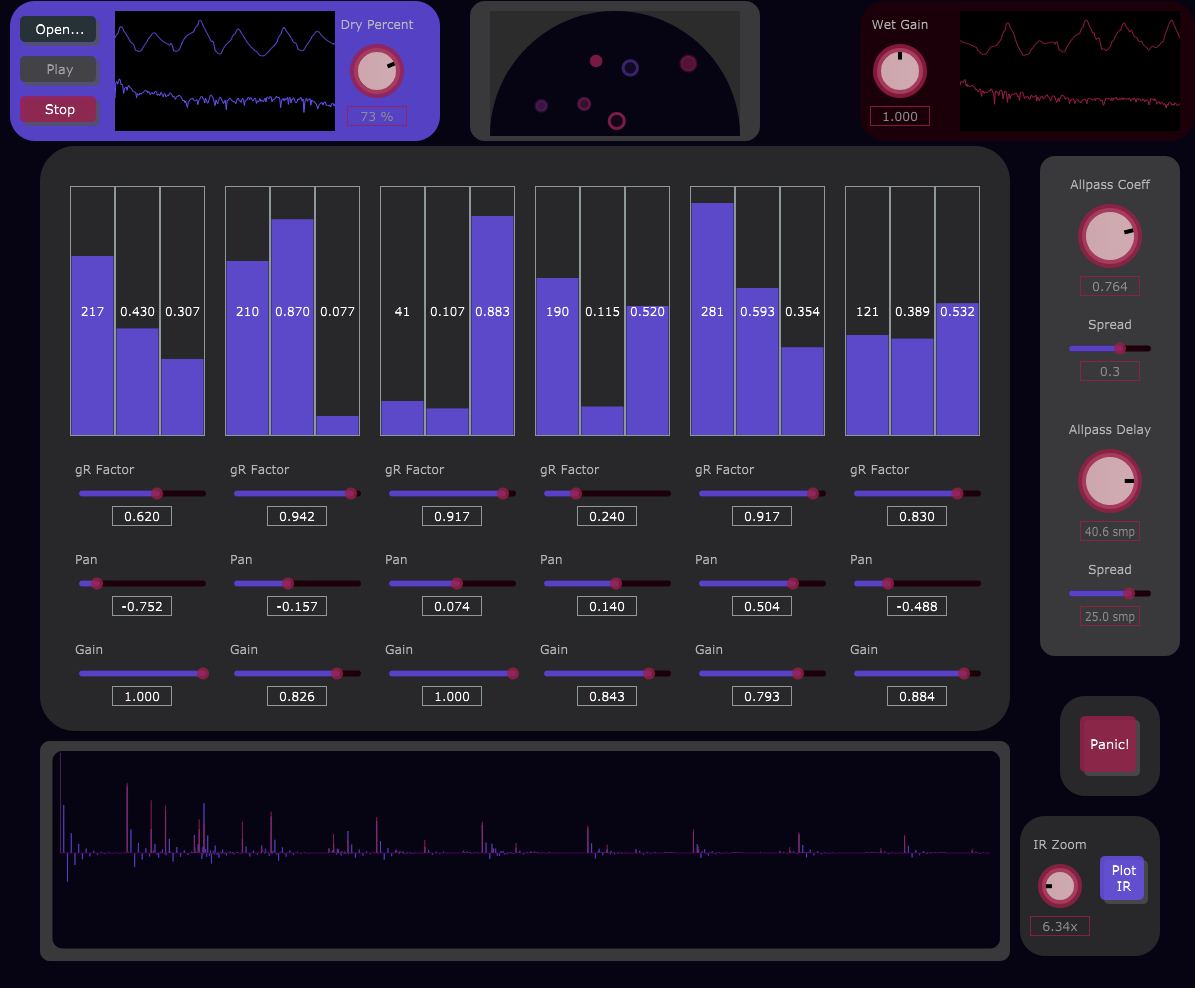
Interface
Controls

Input
Open… : Opens file browser to select input file
Play : Starts playback of the input file.
Stop : Stops playback of the input file.
Dry Percent : Percent of dry signal in the output mix.
This is the inverse of a “dry/wet” control.
Output
Wet Gain : Gain factor of the wet reverb signal.
This can make up for gain lost by the lowpass filters with highly dampened settings.


Delay Network
Each delay tap features the same parameters.
L : Delay time (samples).
g : Lowpass feedback gain coefficient (see transfer function).
R : Comb feedback gain coefficient (see transfer function).
gR Factor : Zero-frequency loop gain. g and R are inversely related by R/(1-g) = gR Factor.
Pan : Left/right stereo mix.
Gain : Gain factor.
Allpass
Allpass Coeff : Allpass coefficient a. Affects amount of phase distortion (see transfer function).
Spread (Allpass Coeff) : Offsets the allpass coefficient of the right stereo channel.
Allpass Delay : Allpass delay m (samples). Affects amount of phase distortion (see transfer function).
Note that fractional sample values are possible via interpolation.
Spread (Allpass Delay) : Offsets the allpass delay of the right stereo channel.


Impulse Response
IR Zoom : Horizontal zoom factor for Impulse Response graph.
Plot IR : Recalculates Impulse Response graph.
This calculation can take a moment and controls may be unresponsive until it completes.
This does not affect audio output.
Panic!
Panic! : Clears all audio buffers.
This can be helpful in the case of accidental infinite feedback or DC offset buildup.
This control will reset any ongoing reverb.

Displays
Input
Signal-Time : Charts the input signal values over time.
This is similar to typical oscilloscope analysis.
Magnitude-Frequency : Charts magnitude of the input signal’s frequency content from 0 Hz to the system’s Nyquist frequency.
This is similar to typical spectrogram analysis or Fourier transform.
Output
Signal-Time : Charts the output signal values over time.
This is similar to typical oscilloscope analysis.
Magnitude-Frequency : Charts magnitude of the output signal’s frequency content from 0 Hz to the system’s Nyquist frequency.
This is similar to typical spectrogram analysis or Fourier transform.

Impulse Response
This displays the reverb’s sample outputs over time when given an input of a single sample of maximum amplitude.
The purple samples represent the left channel while the red samples represent the right channel.
Polar Graph
Each circle illustrates the following parameters of each lowpass comb tap:
- Distance from origin ∝ delay time
- Fill opacity ∝ delay feedback factor
- Outline opacity ∝ lowpass factor
- Hue ∝ gR factor (purple = 0, red = 1)
- Angle in range 0-π ∝ stereo pan
- Size ∝ gain


